Overview
It’s all very well to have the power and flexibility of command-line and API tools to manage complex systems, but sometimes it’s nice, particularly for those of us who are visually oriented, to have a graphical interface to administer some aspects of these applications. Confluent Control Center is just such a tool, and provides a comprehensive web-based interface for managing and monitoring Apache Kafka®. It truly is invaluable when it comes to monitoring production data pipelines and streaming applications, and provides visibility into Kafka components such as:
- Clusters
- Brokers
- Topics
- Consumers
- Data Streams
- Connect
- ksqlDB
As well as displaying current metrics, Control Center also actively monitors the health of your Kafka clusters. It shows trends for important broker and topic health metrics, and facilitates alerting on important cluster key performance indicators (KPIs) and anomalous events in monitoring data. Notifications can be configured for email, Slack, and PagerDuty, and can be paused and resumed across all clusters when necessary.
Components
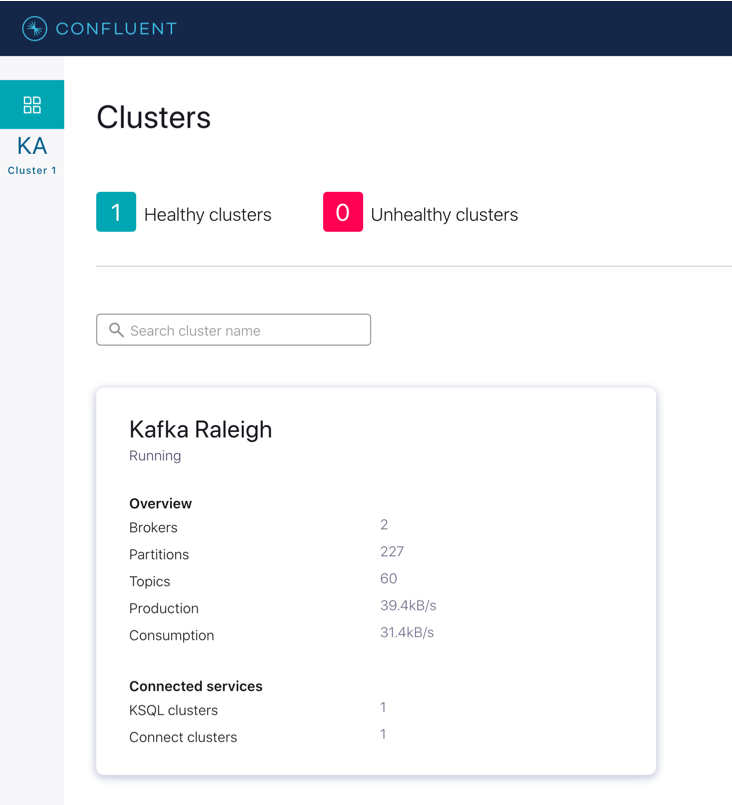
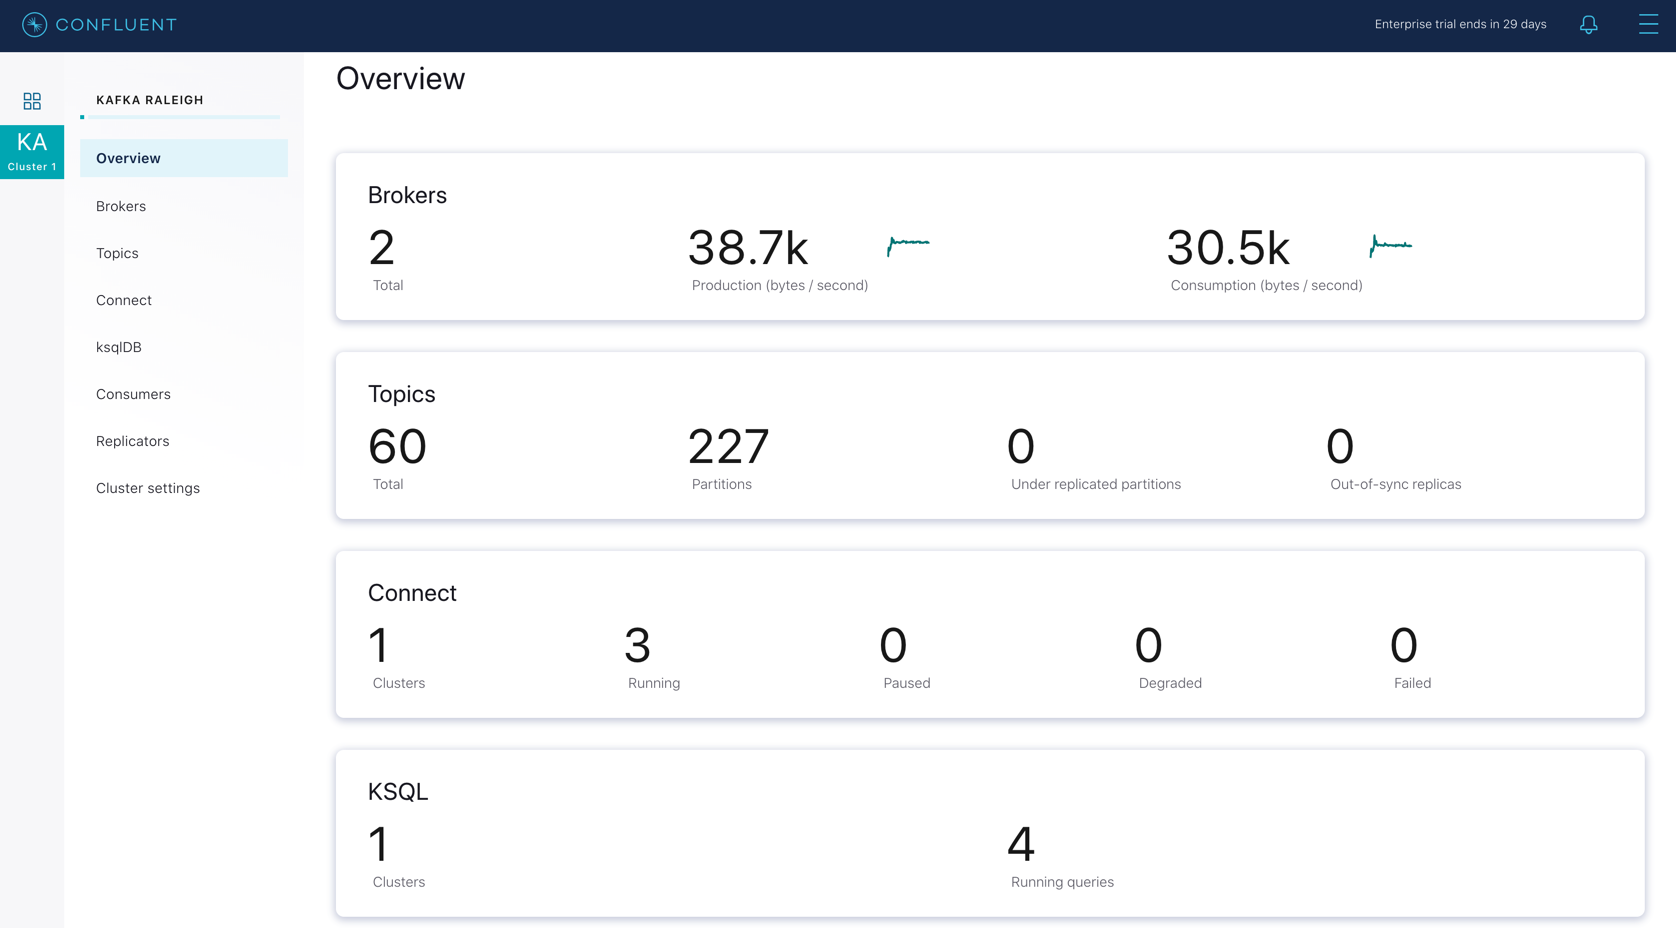
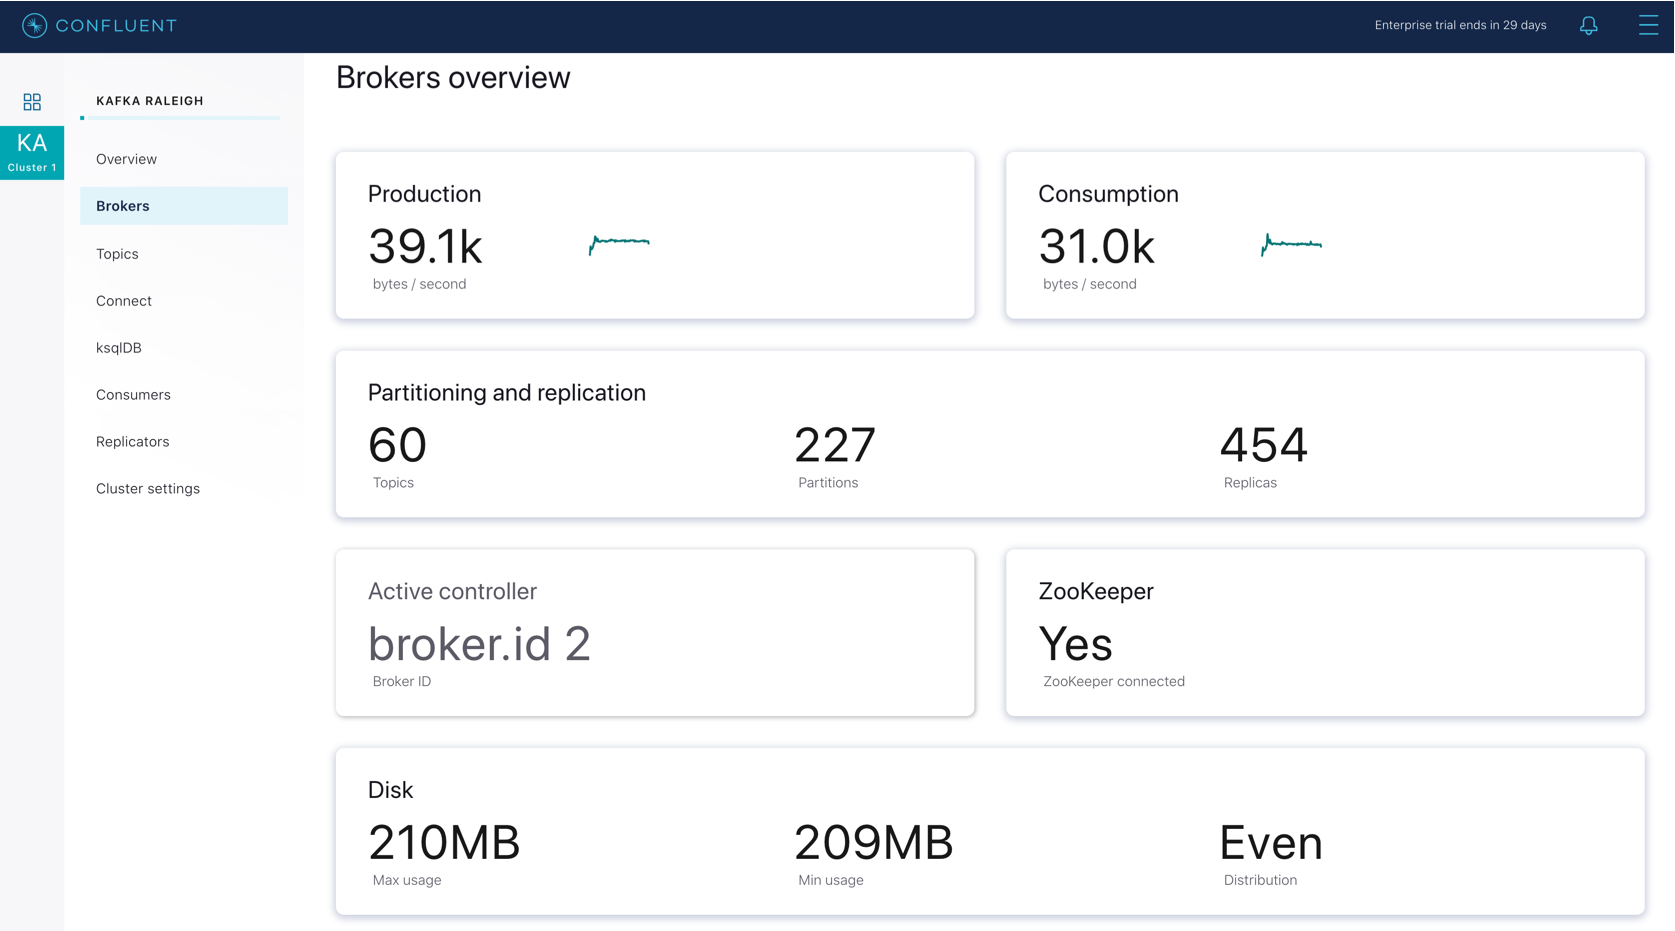
The home screen shows an overview of all configured Clusters, and the respective health of each. Drilling down into a particular Cluster shows an overview of that Cluster and the metrics for its various components. Users can then drill down further into each component, or select them explicitly from the menu on the left.
 |  |
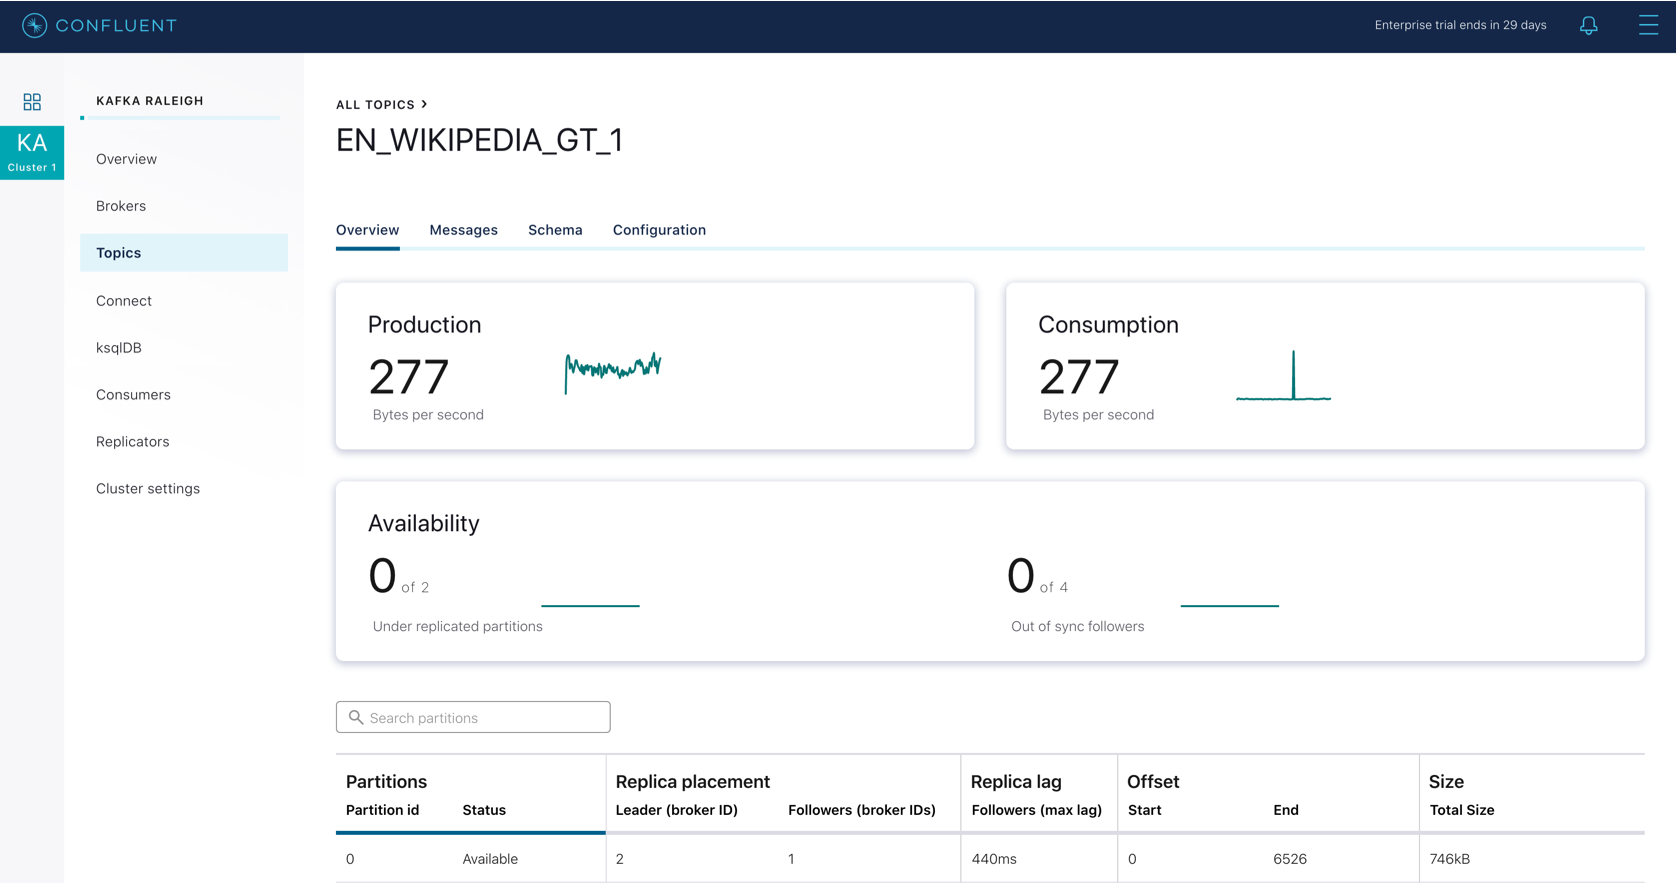
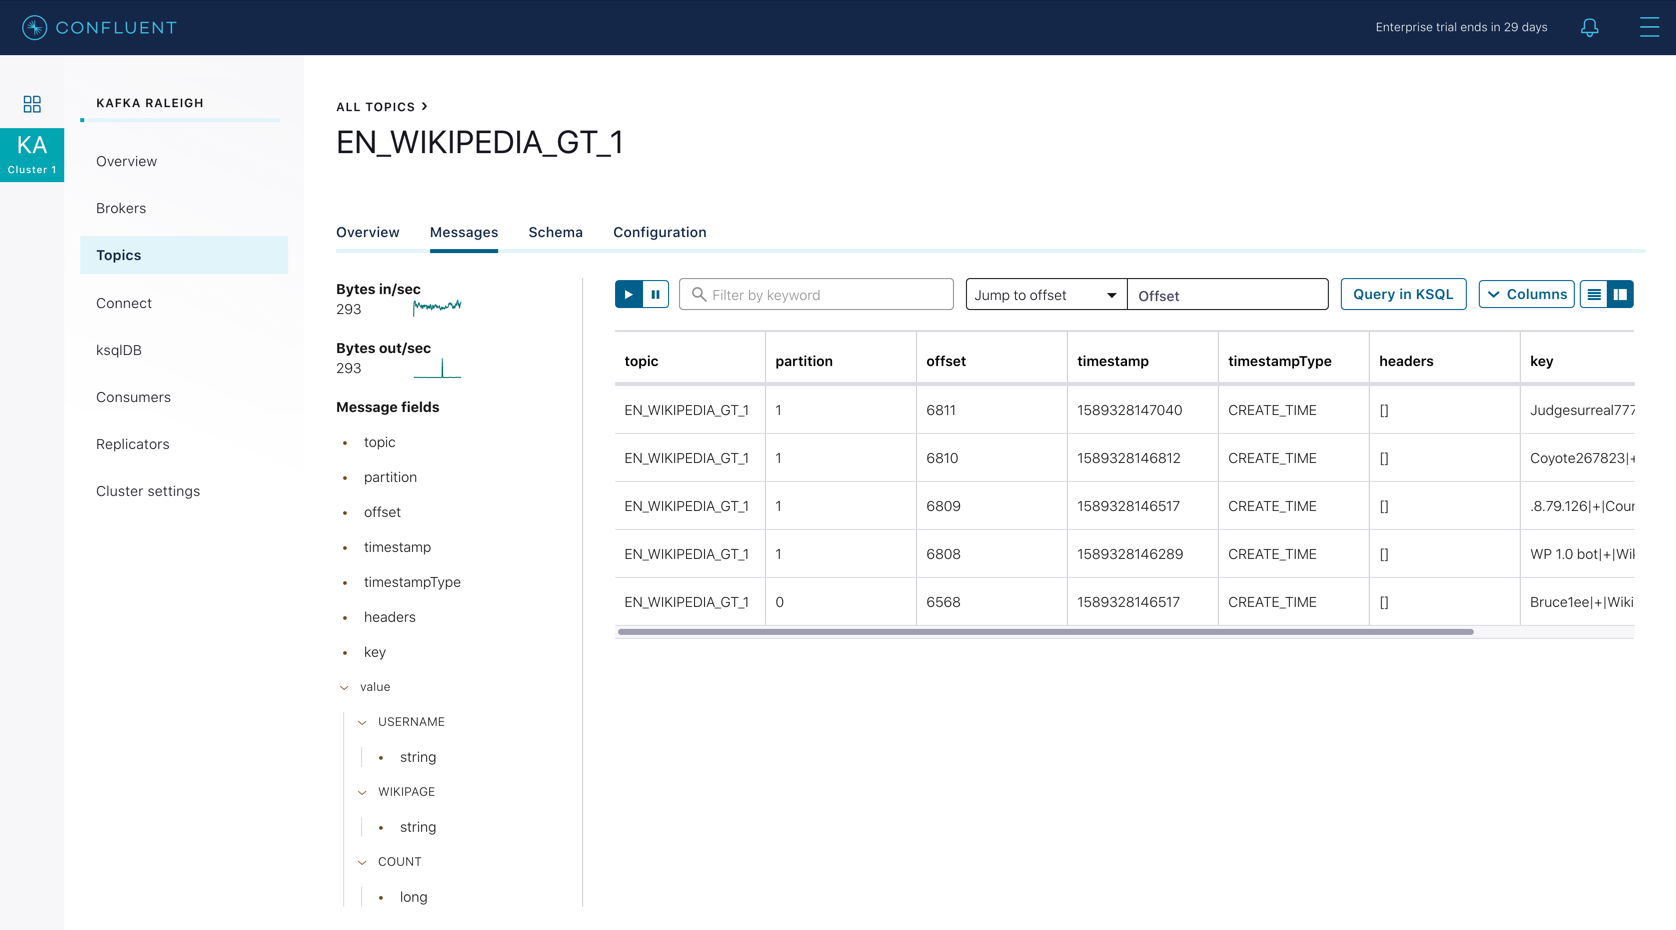
Within each component, a range of actions are possible – for example, a user can drill down into a particular topic where it is possible to view health and metrics for that topic, the actual messages contained in the topic, the schema used to serialise those messages, and any custom settings that have been configured.
 |  |
Drilling into Connect Clusters, ksqlDB tables, Consumers, and Replicators all provide similar options where a user can view metrics/health, data in use, settings and other associated metadata. The breadth of information available for all of the various components is really quite comprehensive.
Alerts
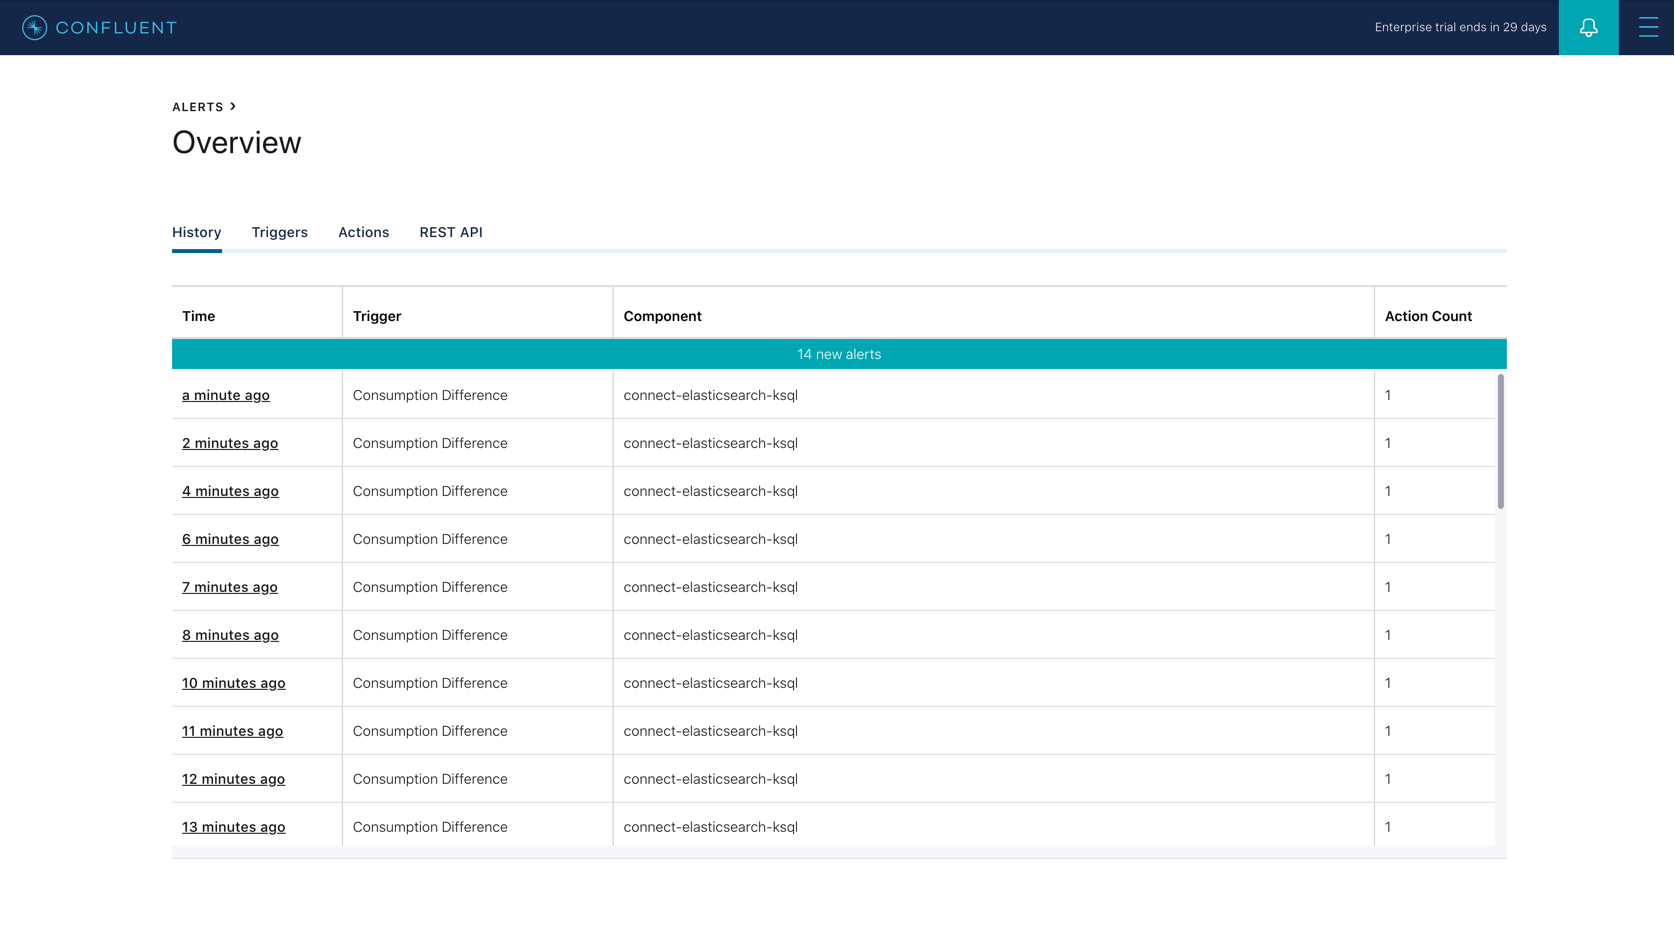
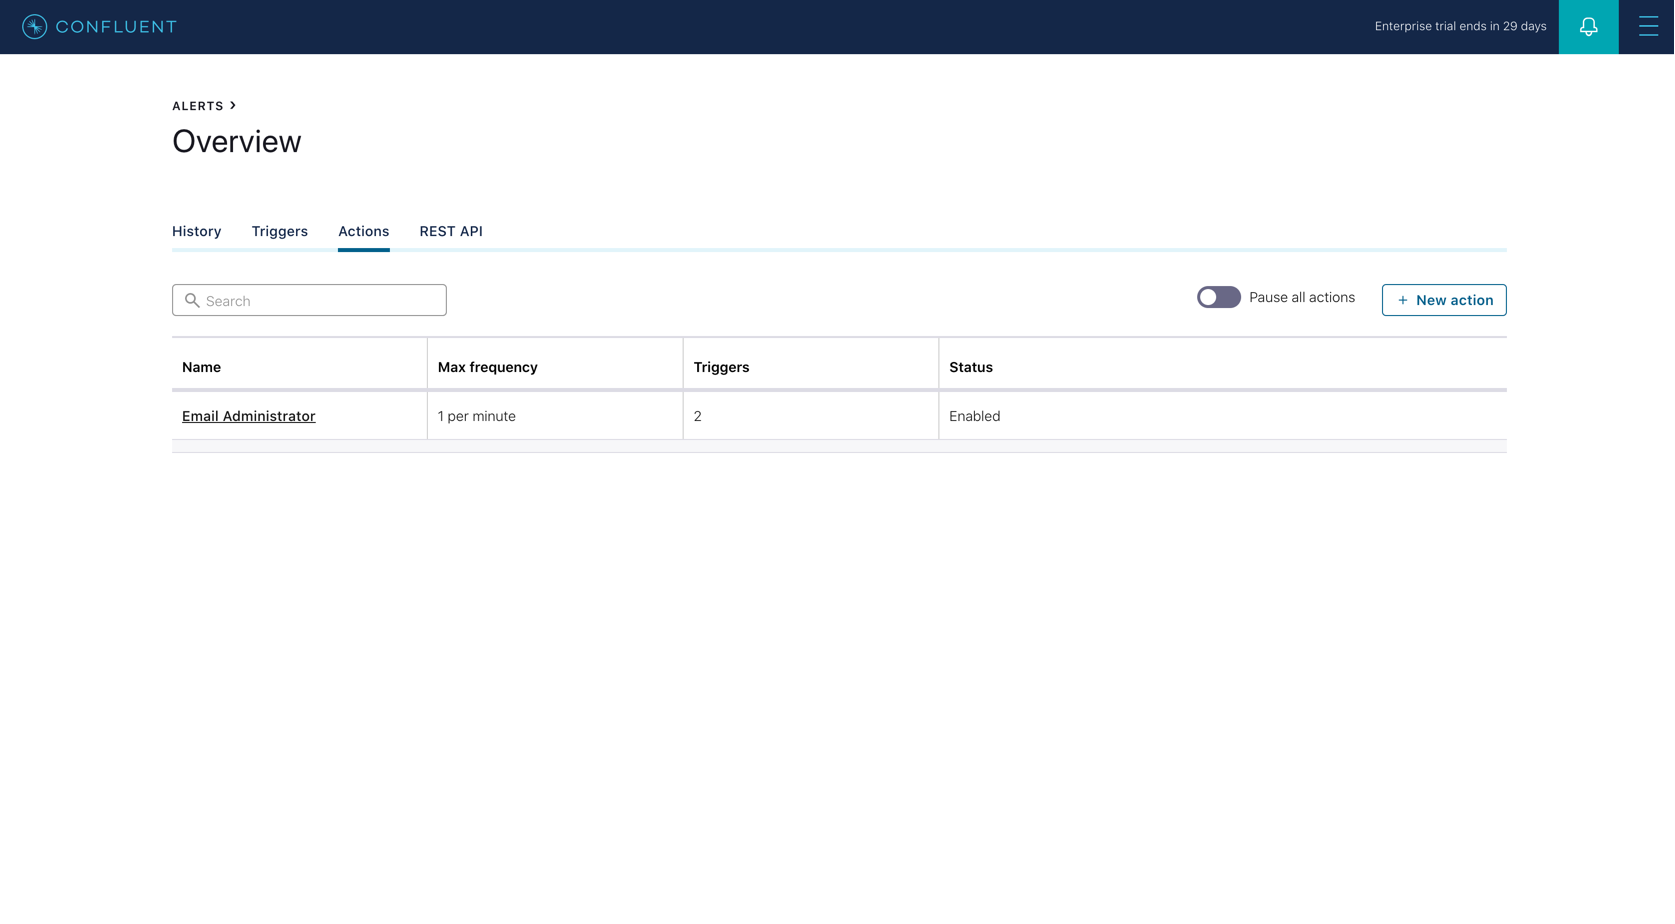
Clicking the Alerts icon on the top right of the web interface takes you to the Alerts screen. Here you can see a history of alerts that have been triggered as configured in the Triggers tab. New alerts can also be configured in that tab, and Actions for those alerts (e.g. send email notification) can be configured in the Actions tab.
 |  |
Roles
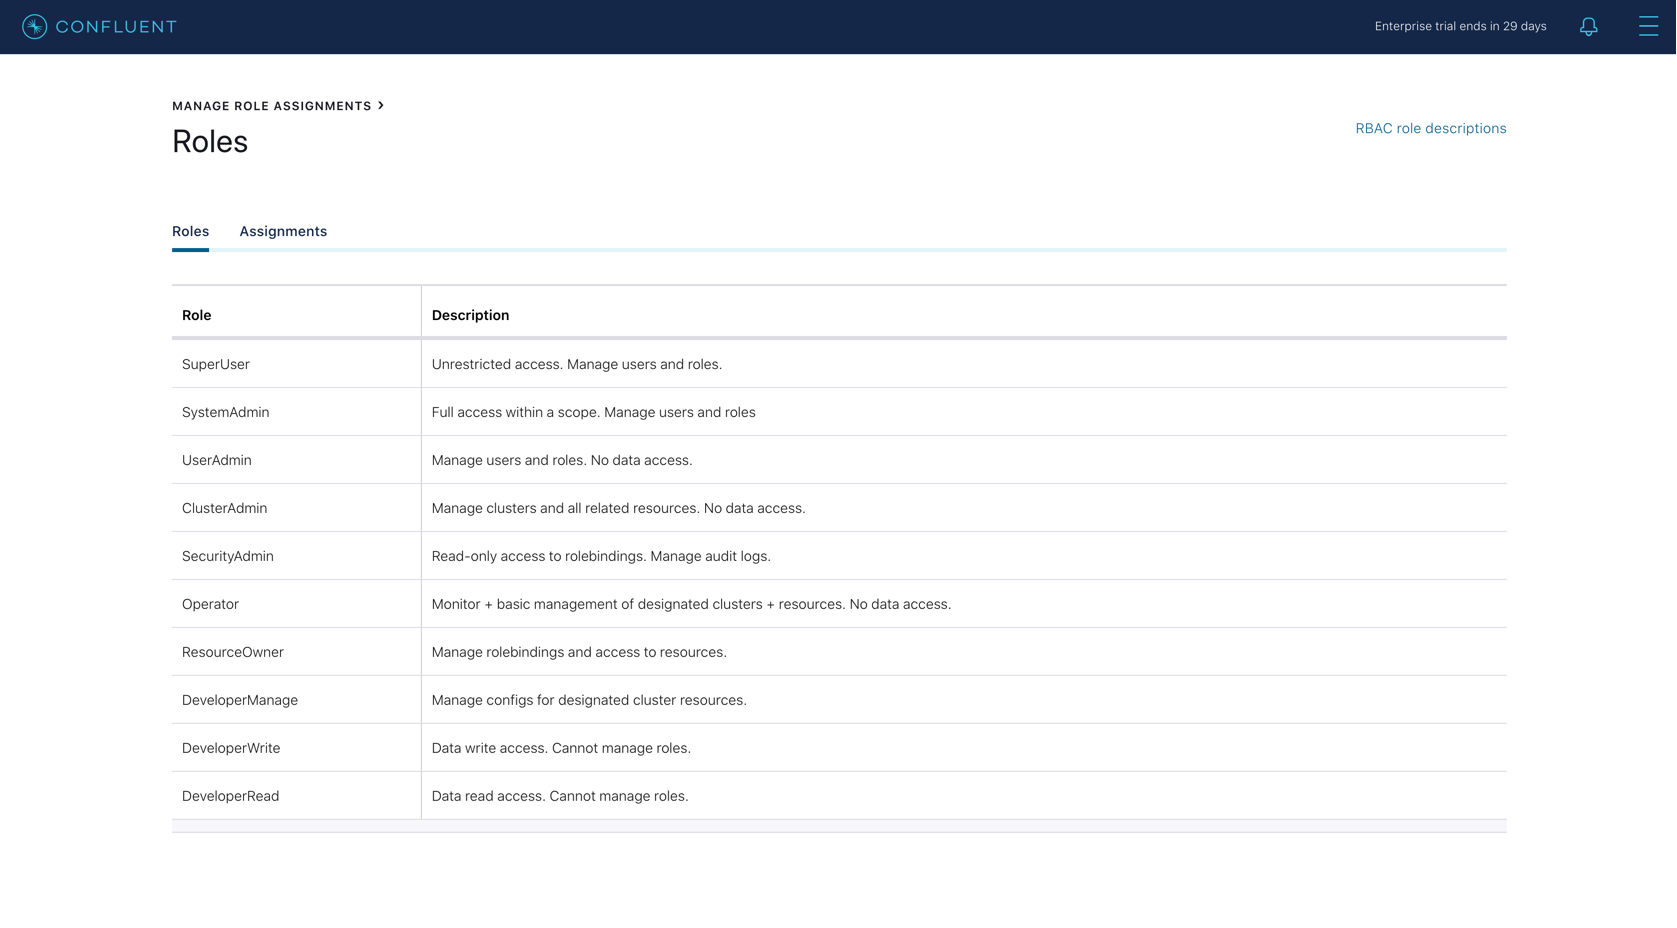
The Administration menu, also on the top right of the web interface, provides options relating to licensing, and role assignments. Role assignments facilitate RBAC (Role-Based Access Control) and allow administrators to configure which users will have access to which Clusters. Roles can be assigned to users or groups as appropriate.
 | 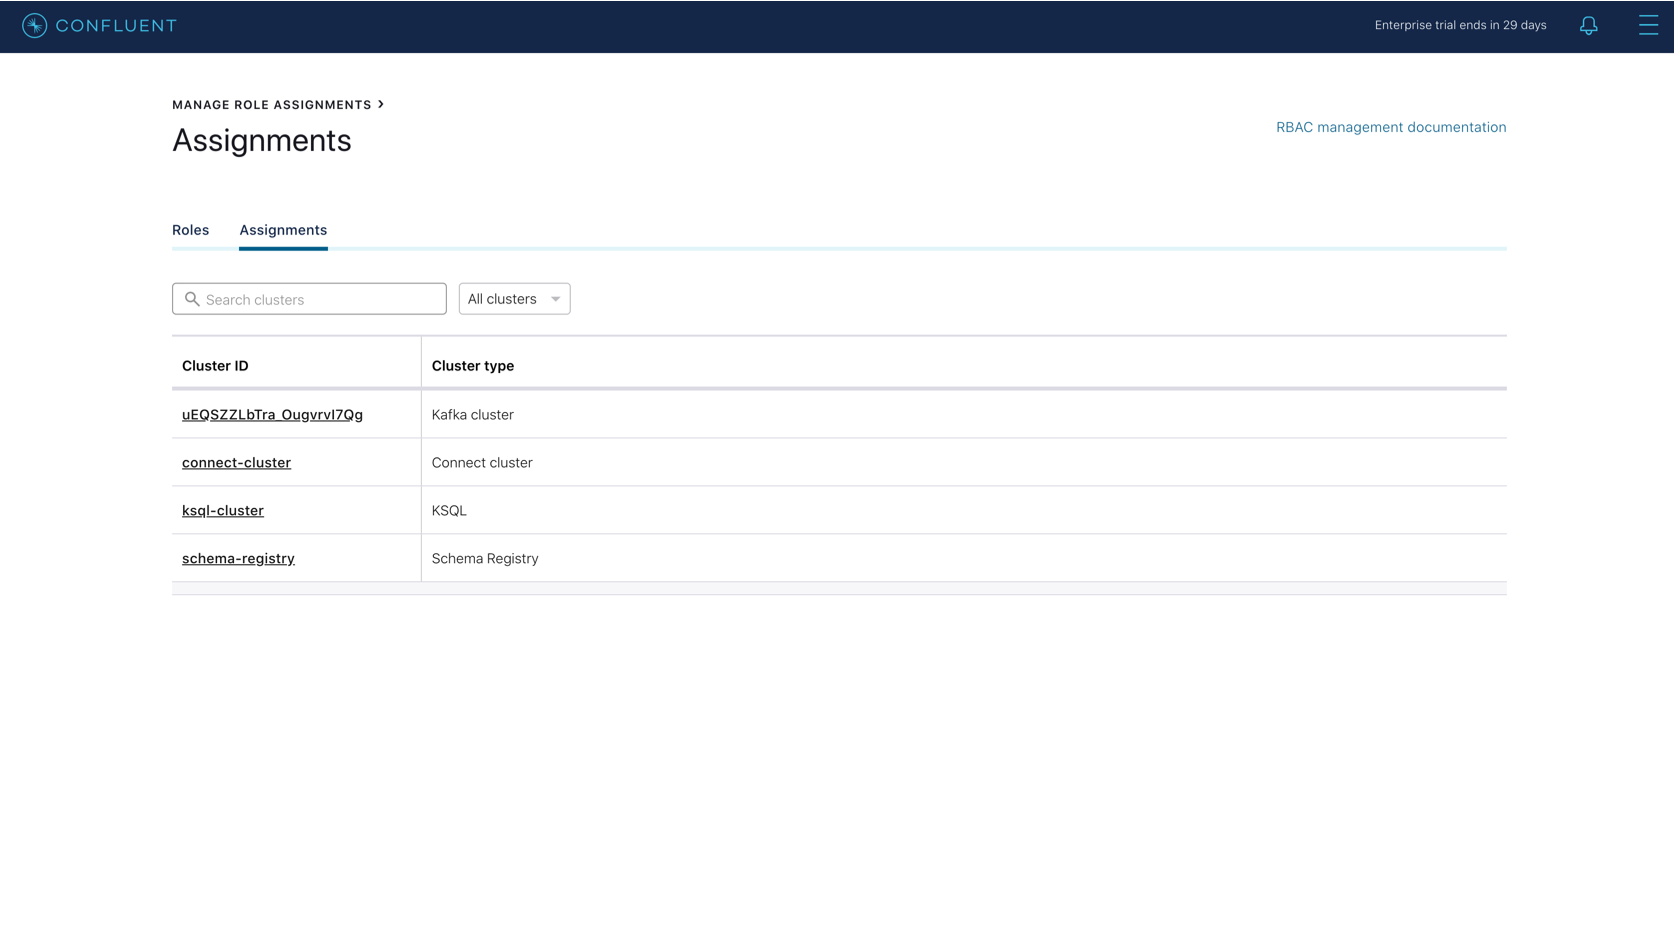 |
Installation
When it comes to installation, this is simple – Control Center is actually a component of Confluent Platform and installed automatically as part of the Confluent Platform bundle. Having said that, it is still necessary to configure Control Center properly – in particular its security, which includes encryption, authentication, and RBAC authorisation. Once configured, the interface is accessible from your browser by simply navigating to the host and port where it is running. For production installations, it is recommended that Control Center be deployed on its own dedicated metrics cluster in order to ensure system health monitoring is available even if the production traffic cluster experiences issues.
Demo
In order to view Confluent Control Center yourself, check out the Confluent Platform Demo at https://docs.confluent.io/current/tutorials/cp-demo/docs/index.html.
Summary
Obviously, this is just a brief look at Control Center and barely scratches the surface of what is possible with this tool. If up until now you’ve been making do with the command-line and API for managing your Confluent Kafka implementation, then it’s well worth investigating Control Center. It is unlikely to completely replace other your methods of administration and control, but having this as another tool in your Confluent arsenal is well worth the time and effort to get it up and going.